
The WhaleWisdom Weekly Sell vs Buy Ratio has shown historically low — bullish — readings for two weeks in a row. For the week ending March 16, 2020, the indicator was 0.27 — the most bullish weekly reading since Nov. 24, 2008’s weekly reading of 0.25. That insider sell vs buy ratio during the financial crisis was the lowest recorded over the last 12 years.
The Sell vs Buy Ratio for last week was 0.42, also very bullish. Only twice before has the indicator shown back-to-back readings below 0.50 — late Nov. 2008 and early March of 2009. Was it up, up and away after those two bullish weekly readings? Not exactly.
The ratio reflects the number of officers and directors buying stock on the open market vs those selling. As I’ve written previously, when key insiders are broadly buying stock in their own companies, and selling very little, history shows that the stock market is approaching a bottom. However, the bottoming process is likely to be a wild ride and may include new bear market lows.
The WhaleWisdom Insider Buy vs Sell Ratio was below 0.50 for the last 2 weeks ending March 20, 2020. A level of bullishness only reached twice before — during 2008-09.
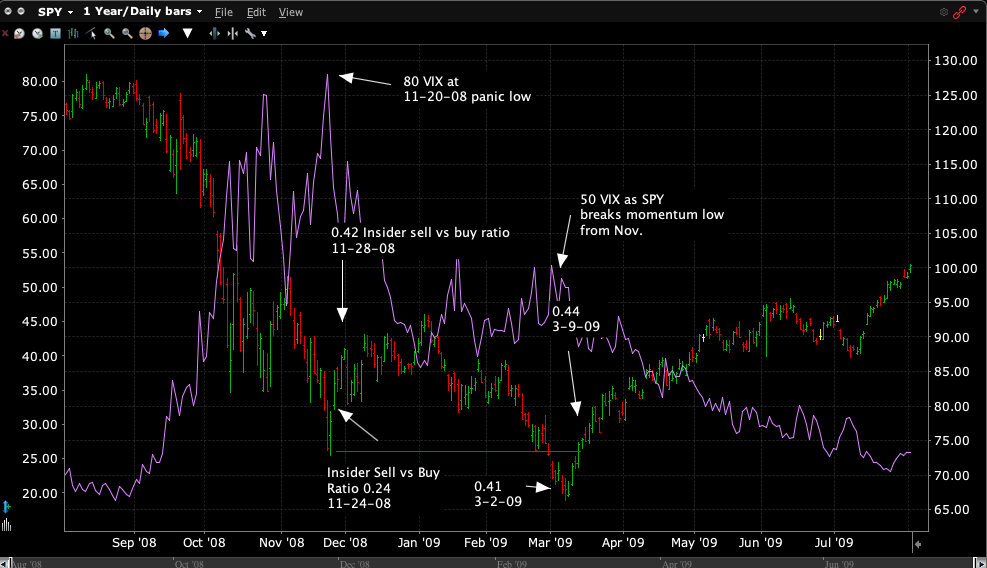
After the 0.24 Insider Ratio for the week ending 11-24-08, there were more 5% moves up and down in the weeks going forward. The market worked higher for about 6 weeks. From the low on Nov. 21, 2008 to the rally high on Jan. 5 of 2009, SPY gained 27%. From there, selling reasserted itself, and SPY declined 29% before making new lows, bottoming on March 6, 2009. Significantly, VIX readings during the breakdown were much lower than in Nov.
The Insider Sell vs Buy Ratio reading of 0.41 for the week ending March 9, 2009, coincided closely with the low for the 2008-09 bear market. As the market climbed into the following week, another bullish reading of 0.44 indicated that officers and directors continued to find extensive bargains in their own shares.
If the Coronavirus bear market plays out like 2008-09, we’ll see more head-spinning volatility in the weeks ahead.
Now of course there is no guarantee that the stock market or insider buying behavior will mirror 2008-09. While the Coronavirus bear market has similarities to the Financial Crisis period, the pandemic is an external shock unlike anything we’ve witnessed in our lifetimes.
Nonetheless, if history is indeed a guide, we can expect elevated volatility in the weeks to come. This means chasing rallies will be a mistake. Long term investors should accumulate on weakness — buy on the big down days. The bear market bottom will be a process over weeks and possibly months. In the coming days there will scary headlines interspersed with periods of hope that the worst is over. The stock market discounts the future. At some point the worst will, in fact, be behind us. And a new period of prosperity, along with a new bull market, will begin.
Before then, however, a break below the reaction low of March 23, 2020 remains a high probability. This is what happened 11 years ago. The market put in a bottom in late Nov. 2008, accompanied by 80+ VIX readings, and extreme insider buying. The market then rallied for five weeks, before turning south again, breaking the previous low. That was the final capitulation — many investors couldn’t stand the pain and threw in the towel. (Insiders, on the other hand were buying the downdraft. Many made millions on stocks bought during this period.) If the market makes new bear market lows with less extreme VIX readings, accompanied by strong insider buying, then a bottom for the Coronavirus bear market would likely be in.
You can follow insider buying at the SEC’s Edgar website or at sites like WhaleWisdom.com.
Contact Mark about investing based on SEC filings and smart money disclosures.
Disclaimer:
This investment blog (the “Blog”) is created and authored by Mark W. Gaffney (the “Content Creator”) and is published and provided for informational and entertainment purposes only (collectively, the “Blog Service”). The information in the Blog constitutes the Content Creator’s own opinions. None of the information contained in the Blog constitutes a recommendation that any particular security, portfolio of securities, transaction, or investment strategy is suitable for any specific person. You understand that the Content Creator is not advising, and will not advise you personally concerning the nature, potential, value or suitability of any particular security, portfolio of securities, transaction, investment strategy or other matter. To the extent any of the information contained in the Blog may be deemed to be investment advice, such information is impersonal and not tailored to the investment needs of any specific person.
From time to time, the Content Creator or its affiliates may hold positions or other interests in securities mentioned in the Blog and may trade for their own account(s) based on the information presented. The Content Creator may also take positions inconsistent with the views expressed in its messages on the Blog.
The Content Creator may hold licenses with FINRA, the SEC or states securities authorities and these licenses may or may not be disclosed by the Content Creator in the Blog.
Investing in the investments discussed in the Blog may be risky and speculative. The companies may have limited operating histories, little available public information, and the stocks they issue may be volatile and illiquid. Trading in such securities can result in immediate and substantial losses of the capital invested. You should use invest risk capital, and not capital required for other purposes, such as retirement savings, student loans, mortgages or education.


