
Facebook went public on May 18, 2012 at $38 per share and proceeded to lose 50% over the next four months. But behind the scenes, institutional investors were accumulating the stock. And they’ve been buying FB nearly nonstop ever since. Every quarter since Q2 2012 showed net buying by investment funds…until the first quarter of 2018.
| Date | FB Net Fund Buyers | # Funds Holding FB |
|---|---|---|
| Q2 2012 | 435 | 438 |
| Q3 2012 | 91 | 457 |
| Q4 2012 | 336 | 634 |
| Q1 2013 | 135 | 617 |
| Q2 2013 | 146 | 664 |
| Q3 2013 | 227 | 835 |
| Q4 2013 | 137 | 948 |
| Q1 2014 | 88 | 992 |
| Q2 2014 | 216 | 1039 |
| Q3 2014 | 195 | 1095 |
| Q4 2014 | 278 | 1201 |
| Q1 2015 | 219 | 1259 |
| Q2 2015 | 338 | 1323 |
| Q3 2015 | 356 | 1372 |
| Q4 2015 | 336 | 1528 |
| Q1 2016 | 195 | 1604 |
| Q2 2016 | 190 | 1634 |
| Q3 2016 | 237 | 1669 |
| Q4 2016 | 248 | 1754 |
| Q1 2017 | 199 | 1844 |
| Q2 2017 | 283 | 1913 |
| Q3 2017 | 133 | 1959 |
| Q4 2017 | 347 | 2157 |
| Q1 2018 | -192 | 2140 |
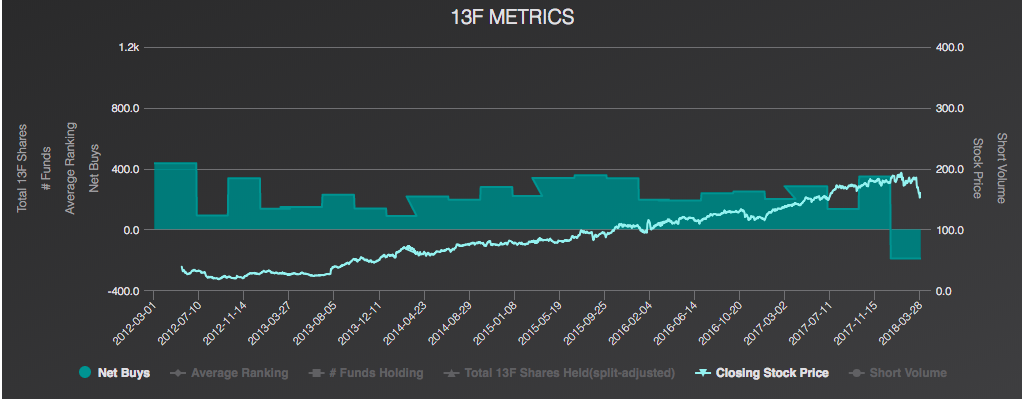
According to WhaleWisdom.com, 13F filings reflecting FB holdings for the 2nd quarter of 2012 showed that 435 institutions had purchased FB, and 3 had reduced their positions. Remarkably, in every quarter since, the number of institutions adding shares was more than the number of funds reducing holdings.
But when 13F filings were published in mid-May of 2018, it showed that for the first time since its IPO, more funds reduced FB holdings over a quarter than added shares. In Q1, 192 more funds had pared-down FB positions than had increased FB shares (left). While not a huge shift in institutional sponsorship, this indicator was possibly the canary in the coal mine, signaling that FB’s relentless institutional buying momentum had stalled.
And of course, we know what happened two months later on July 26. In response to disappointing second-quarter earnings, in which Facebook warned of a significant slowdown in sales growth in coming quarters along with rising spending, Facebook shares plummeted 19%. The company’s market cap loss of $119 billion was the largest ever by a stock in one day.
Facebook, as you probably know, is the “F” in FAANG – along with Amazon, Apple, Netflix and Google (Alphabet). This group of tech-related stocks has been the backbone of the bull market, significantly outperforming the S&P 500. Investment fund buying has been the driving factor in FAANG’s inexorable gains, as a feedback loop of price appreciation and fund buying pulls ever more institutional money into the stocks.
But with Facebook suddenly stumbling, one wonders if the FAANG juggernaut is feeling the effects of gravity. Just as the Q1 2018 dip in fund buying offered a hint of FB’s stumble, are there signs that the other FAANG stocks may be losing their relentless fund sponsorship?
Amazon shares have soared in 2018, up 48% versus the S&P’s 2.76% gain. AMZN’s five-year gain is nearly 500%, mainly thanks to an ongoing feeding frenzy by big investors. Since the 2nd quarter of 2013, the number of funds holding AMZN has increased every quarter (red line below), growing from 855 to 2213. Every quarter over that period has seen more funds buy then sell AMZN shares (green bars). When will fund managers’ appetite for AMZN shares wane?
Amazon net buys and # of Funds Holding since mid-2013.
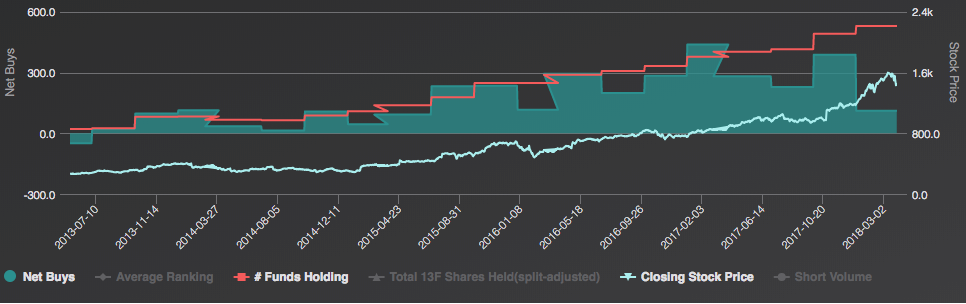
Source: WhaleWisdom.com
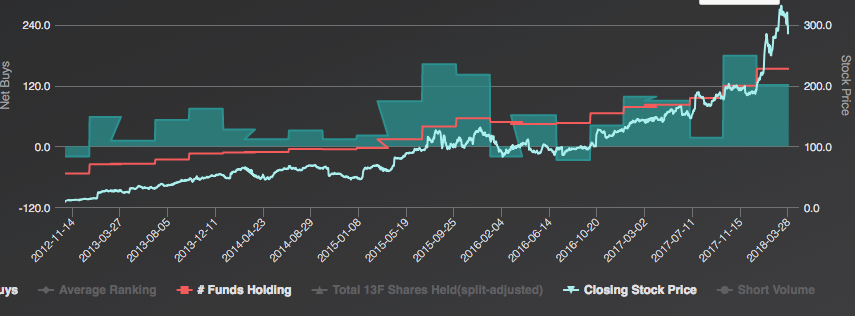
Netflix shows a similar picture of institutional investor infatuation. During 2016, when NFLX was consolidating around $100, there were a couple quarters with small net selling by funds, but since then, NFLX has been on a tear, it’s price tripling over the last two years.as funds can’t get enough of the stock.
NFLX quarterly net buys and # of funds holding since 3rd quarter 2012.
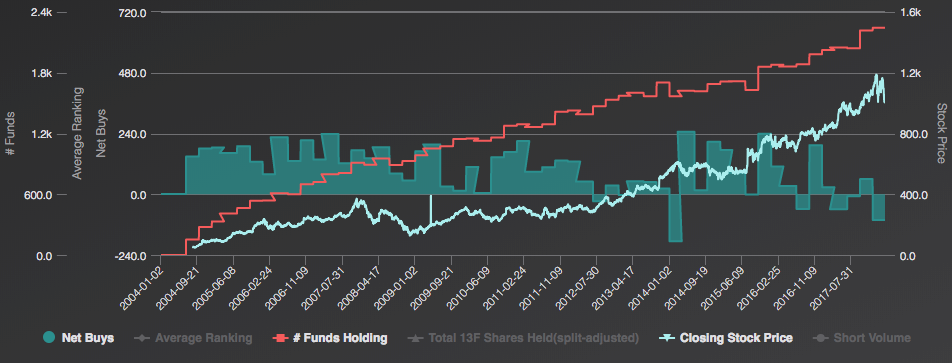
Google (GOOGL) has not shown the uninterrupted accumulation seen at Amazon and Netflix in recent quarters. In the 1st quarter of 2014, funds were net sellers of the stock. As it turns out, this preceded an 18-month sideways consolidation by GOOGL. However, in July of 2016 Google broke to new highs and hasn’t looked back, gaining nearly 60% over the last two years. It’s worth noting that two of the last three quarters have shown institutions to be net sellers.
GOOGL quarterly net buys and # of funds holding since 1st quarter of 2004.
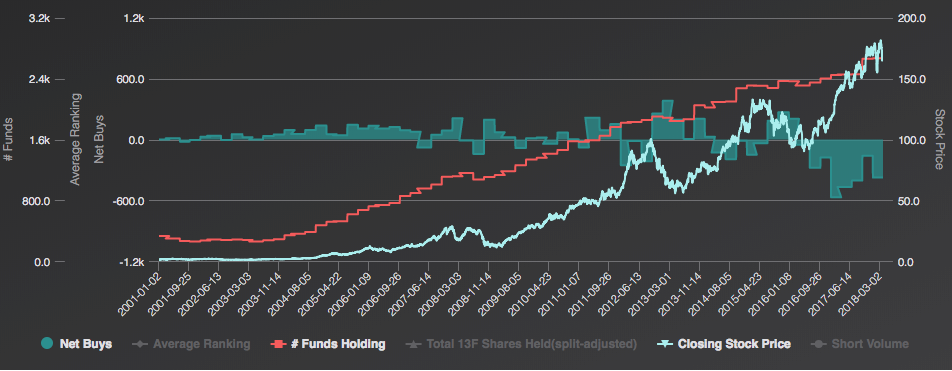
Meanwhile, though Apple shares are up nearly 80% over the last two years, and have outperformed the S&P handily YTD by rallying 9%, the Net Buying indicator appears to be flashing a warning on AAPL. The last six quarters have shown net selling by funds.
AAPL quarterly net buys and # of funds holding since 1st quarter of 2001.
It has become a given on Wall Street that quarter after quarter, year after year, the world’s leading tech companies will keep attracting new users, generating ever-more revenues and market-beating stock performance. But with Facebook’s trend of ongoing fund accumulation and stock appreciation apparently broken, it makes sense to watch the other FAANG stocks for signs of waning bullishness by institutions.


