
Whale Rock Capital’s returns have been hard to beat. An equal-weighted portfolio of Whale Rock’s top ten long 13F positions, rebalanced quarterly, has averaged a 17.30% annual return since the fund’s inception in 2006. The fund’s 10-year annualized performance of 25.57% is #2 among all fund’s in the WhaleWisdom.com database. Over the last three years, the fund ranks #14 out of the 807 hedge funds with over 9 positions, sporting a 30.52% annual return. And over the last year, Whale Rock’s 13F holdings have produced a 18.97% return — 17th best among hedge funds.
Whale Rock’s focus is the technology, media and telecom (TMT) sector. When it comes to creating wealth by investing in TMT, Whale Rock Capital’s returns are in a league of their own. The genius behind Whale Rock is Alexander Sacerdote, the company’s founder, principal owner and portfolio manager. Sacerdote is definitely not a household name, but deserves to be mentioned among the elite fund managers working today.
Whale Rock Capital has been closed to new money since Dec. 2017. But 13Fs are a “back door” way to follow Sacerdote’s moves — and profit from them.
However, if you’re an investor looking to invest with Whale Rock Capital, forget about it — Sacerdote stopped accepting new capital in December of 2017, capping the fund at $2.5 billion. Even without new money inflows, Whale Rock Capital’s assets under management had grown to $5.7 billion as of 2018 year-end, based on appreciation alone. Still there is a “back door” way to profit from Sacerdote’s prescient moves — follow the quarterly 13F filings of Whale Rock.
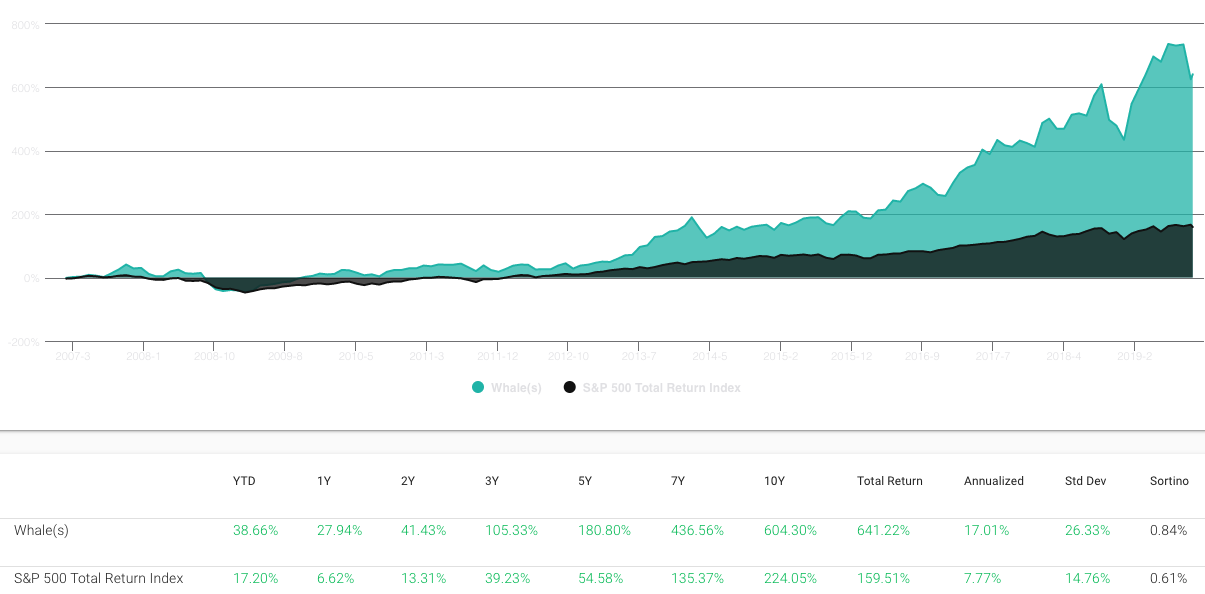
Whale Rock Capital’s returns vs the S&P 500 going back to 2007:
The secret to Whale Rock Capital’s returns? Sacerdote’s ability to identify an emerging technology’s S-curve, an inflection point, and the companies most impacted.
So how has Alex Sacerdote done it? How has the former analyst and sector portfolio manager at Fidelity Investments vastly outperformed most other tech managers since setting up Whale Rock in 2006? Sacerdote’s “secret” is identifying an emerging technology and determining where the technology is on its “S-curve.” From a Nov. 2018 interview with Graham and Doddsville:
“All technology adoption starts very slowly. It can be held back for a variety of reasons: high price, complex products, lack of an ecosystem. At some point, these barriers are removed, and the technology moves on the S- curve from the early adopter phase into the majority phase. At that point a massive wave of demand kicks in, and you can see three to four years of incredible unit growth. Everybody says tech is so unpredictable, but if you understand the way S-curves work, it actually can be quite predictable during certain time periods. You are able to understand how fast units might grow over a three to five year period. In analyzing the S-curve, it’s important to assess both the slope of the curve as well as the height of the curve.”
Here were Whale Rock’s top 10 holdings as of Q2 2019 close. From WhaleWisdom.com
| Stock | Shares Held | Mkt Vlue | % of Portfolio | Rank | % Change | Qtr 1st Owned | Est Avg Price |
| COUP | 3,141,702 | $397,771,000 | 6.81 | 1 | 0% | Q1 2018 | 60.9 |
| AMZN | 208,773 | $395,339,000 | 6.77 | 2 | 11% | Q1 2015 | 1,060.25 |
| FB | 1,323,530 | $255,441,000 | 4.37 | 3 | 8% | Q1 2015 | 141.98 |
| SMAR | 5,030,271 | $243,465,000 | 4.17 | 4 | 87% | Q3 2018 | 36.65 |
| SHOP | 778,056 | $233,534,000 | 4 | 5 | -20% | Q4 2015 | 64.39 |
| OKTA | 1,870,680 | $231,048,000 | 3.96 | 6 | 0% | Q3 2018 | 70.36 |
| TWLO | 1,693,992 | $230,976,000 | 3.95 | 7 | 0% | Q2 2018 | 72.6 |
| AYX | 2,083,414 | $227,342,000 | 3.89 | 8 | 175% | Q1 2018 | 96.35 |
| ZEN | 2,343,257 | $208,620,000 | 3.57 | 9 | 0% | Q2 2014 | 33.28 |
| W | 1,404,590 | $205,070,000 | 3.51 | 10 | 8% | Q4 2018 | 133.41 |
According to Sacerdote, a key to his methodology is identifying the “inflection point” in the S-curve of a technology.
“Understanding where a technology sits along the S- curve and if you are nearing that inflection point is powerful. The inflection point not only creates incredible unit growth, but it also reduces risk because one of the biggest drivers of tech company failures is faltering demand or demand well below expectations. It’s very hard for that to happen in the middle of an inflection point on the S- curve. Sometimes understanding the S-curve can help you time your exit as well. When adoption gets close to 50%, growth can rapidly decelerate.”
Once a technology with an attractive S-curve is identified, along with a compelling inflection point, the next thing Sacerdote does is search for companies benefiting from the S-curve that have strong competitive advantages. From Whale Rock’s ADV:
“We seek to identify technological, social and economic trends that generate significant product cycles and industry inflection points and then analyze the sub-sectors and/or companies with the most exposure (both positive and negative) to these trends. We seek to analyze the relevant information to understand the longer-term valuation implications before the broader market does. Accordingly, our investment strategy is generally expected to be longer-term in nature. Once significant trends and inflection points are identified, we look for companies whose sales and profits will benefit from these trends and that have at least some of the following characteristics: strong business models and competitive advantages, underappreciated earnings power, reasonable valuations and good management.”
Whale Rock also shorts stocks it views as negatively impacted by an inflection in a technology’s S-curve.
Sacerdote also invests in short positions within the Whale Rock portfolio. Of course, 13F filings do not disclose the short holdings of funds, so anyone replicating the 13F investments of Whale Rock is not benefiting from the manager’s short ideas. Again from the fund’s ADV:
“On the short side, we look for companies that will be negatively impacted by these trends and also have some of the following characteristics: weak business models, deteriorating competitive positions, unreasonable valuations (although this is rarely sufficient in its own right), over-hyped business opportunities and poor management. Emphasis is put on balance sheet and cash flow analysis, particularly when free cash flow is significantly lower than net income. In addition to investing in companies that benefit from the identified trends, we are often attracted to other investment attributes, such as: turnarounds, management changes, value creating acquisitions, shareholder friendly capital structure actions, such as stock buybacks, and prudent use of leverage. The Funds’ investment strategy includes using leverage in pursuit of additional return. The Funds are generally expected to have a net long bias.”
Disclaimer:
Do not construe anything written in this post or this blog in its entirety as a recommendation, research, or an offer to buy or sell any securities. Everything in this blog is meant for educational and informational purposes only. Do your own research before investing and don’t risk more than you can afford to lose. This article expresses my own opinions, and I am not receiving compensation for it (other than from WhaleWisdom). If you buy a book after clicking on one of the above links, I may received an affiliate fee. I do not have a business relationship with any company whose stock is mentioned in this article. I or my associates may hold positions in the stocks discussed.


