
James Simons’ Renaissance Technologies is possibly the most successful hedge fund in history. Renaissance’s Medallion fund, available only to the firm’s employees, has reportedly generated returns of almost 80% a year before fees since inception in 1988. After a 5% management fee and 44% performance fee, that’s still about 40% a year.
Renaissance Technologies’ extreme success is matched by the firms extreme secrecy. Almost no one knows what goes on inside the leading quant fund. As a result, the firm is the subject of much wonder and fascination. What exactly is inside Renaissance Technologies’ black box?
Long Island-based Renaissance was founded in 1982 by 81-year-old James Simons — a math genius, former military code-breaker, string theory scientist, Harvard and MIT professor. Simons has leveraged Renaissance’s performance into personal net worth of over $21 billion. Since Simons went into semi-retirement in 2009, the firm is now run by Peter Brown, a computational linguistics expert who joined Renaissance in 1993 from IBM research. The firm has roughly 300 employees, all of them scientists, a significant number of them Ph.D.s.
This 2014 statement by the hedge fund to the Senate Permanent Subcommittee on Investigations offers a clue to Renaissance Technologies’ strategies:
“We collect all the publicly available data we can find that we believe might bear on the movement of the prices of tradable instruments—news stories, analysts’ reports, energy reports, crop reports, weather reports, regulatory filings, accounting data, and, of course, quotes and trades from markets around the world. Our models use this data to make predictions about future price changes. Although we use different strategies in managing our different funds, all of our strategies depend on the output of our data driven models.”
Renaissance Technologies’ strategies are not all high-frequency.
But not all of the quant firm’s trading is short-term, high frequency. In 2000, a source told Institutional Investor that Medallion’s “positions are held anywhere from seconds to seasons.” Indeed, in addition to the internal Medallion Fund, Renaissance manages three public funds which hold positions over longer time-frames. The firm publishes 13F holdings for these funds quarterly, like all funds with over $100 million under management.
So while it’s impossible to look inside the Medallion Fund’s black box, there is a way for investors to analyze — and profit from — some of Renaissance’s moves.
Strategies based on Renaissance’s quarterly disclosures won’t match the astronomical returns of Medallion, but “cloning” Renaissance 13Fs would have produced impressive returns in recent years — especially when you consider there are no fees.
The three outside funds for which Renaissance Technologies files 13Fs include:
- The Renaissance Institutional Equities Fund, which employs a net-long trading strategy in U.S. and non-U.S equity securities that are publicly traded on U.S. securities exchanges (and certain derivatives thereon). The hedge fund gained 8.5% in 2018 after fees.
- Renaissance Institutional Diversified Alpha Fund, which trades equity securities that are publicly traded on global securities exchanges as well as various instruments in the global futures and forwards markets. It returned 3.23% last year.
- The Renaissance Institutional Diversified Global Equities Fund, which employs a market-neutral strategy, trades equities listed on global securities exchanges. This fund made 10.3% in 2018.
“Cloning” Renaissance Technologies’ 13F positions would have returned 16% annually over the last 5 years.
It’s important to note that 13F filings do not include short positions or many derivatives. So investors piggybacking on Renaissance’s fund holdings are not truly replicating the firm’s strategies. To do that one would have to place money with the hedge fund ( and pay significant fees, of course.)
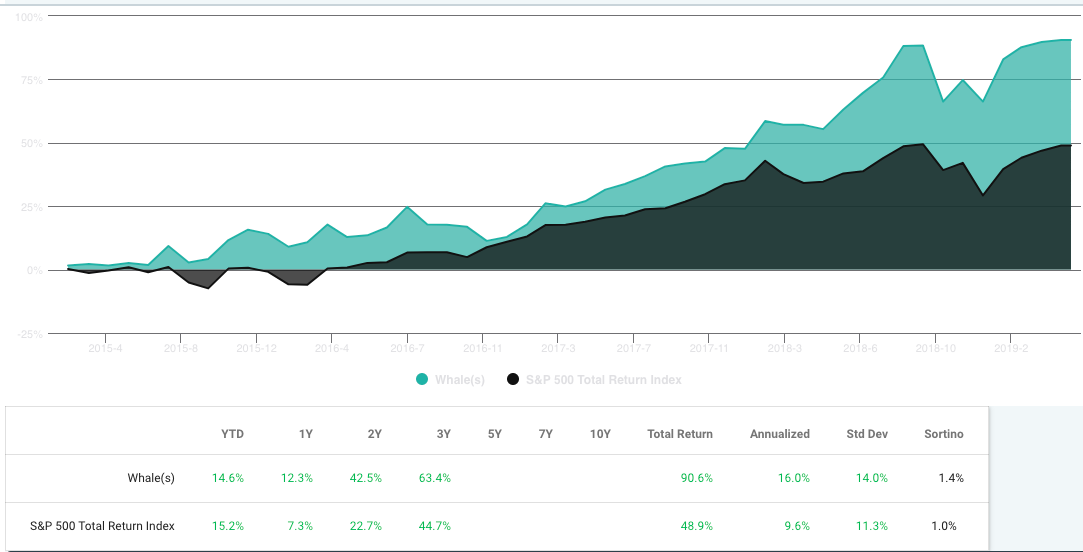
In any case, over the last five years “cloning” the 13F long positions of Renaissance Technologies would have generated a 16% annual total return vs 9.6% for the S&P 500. This test was performed using WhaleWisdom.com’s Backtester.
Cloning Renaissance’s positions is straightforward: Watch for new 13F holdings to be disclosed at the SEC’s website or at WhaleWisdom.com, 45 days after the end of a calendar quarter. Buy equal weightings of Renaissance’s top 10 largest positions. Then rebalance quarterly when the new 13F is published.
The chart below shows that since 2015, the 13F portfolio of Renaissance Technologies returned 90.6% vs 48.9% vs the S&P 500. This was during a period when few hedge funds outperformed the S&P. Renaissance’s 13F portfolio’s Sharpe ratio, a measure of risk-adjusted performance, was 1.12 over the last five years. This is among the top Sharpe ratios of all hedge funds with assets over $100 million, according to WhaleWisdom.com.
We’ll never get to peer inside Renaissance Technologies’ black box, but cloning the firm’s 13Fs might be the next best thing.
Below are Renaissance Technology’s top ten holdings, based on the firm’s 13F for Q4 2018.
| Stock | Symbol | Shares Held | Market Value | Avg Price | % of Portfolio | Ranking | % Change in Shrs | Qtr first owned |
| Verisign inc. | VRSN | 7,031,000 | 1,042,627,000 | 74.1287 | 1.1415% | 1 | (0.0966%) | Q3 2009 |
| Humana inc. | HUM | 3,507,800 | 1,004,915,000 | 231.2828 | 1.1003% | 2 | 10.4889% | Q2 2015 |
| Novo-nordisk a/s ads | NVO | 20,744,571 | 955,702,000 | 35.4081 | 1.0464% | 3 | 5.4808% | Q3 2005 |
| Palo alto networks inc | PANW | 4,304,450 | 810,743,000 | 163.0758 | 0.8877% | 4 | (7.4551%) | Q2 2015 |
| Pepsico inc. (loft inc.) | PEP | 7,280,250 | 804,322,000 | 110.2226 | 0.8806% | 5 | 9.9694% | Q1 2012 |
| Facebook inc | FB | 6,009,362 | 787,767,000 | 161.8564 | 0.8625% | 6 | 80.3229% | Q4 2015 |
| Dominos pizza inc | DPZ | 3,085,500 | 765,173,000 | 140.1954 | 0.8378% | 7 | (3.0875%) | Q1 2011 |
| Vertex pharmaceuticals inc. | VRTX | 4,334,300 | 718,237,000 | 157.1844 | 0.7864% | 8 | 5.996% | Q1 2017 |
| Duke energy corp. | DUK | 8,209,779 | 708,504,000 | 82.0176 | 0.7757% | 9 | 35.6735% | Q1 2014 |
| Amgen inc. | AMGN | 3,578,600 | 696,646,000 | 170.1824 | 0.7627% | 10 | (13.0383%) | Q4 2007 |
Disclaimer: Do not construe anything written in this post or this blog in its entirety as a recommendation, research, or an offer to buy or sell any securities. Everything in this blog is meant for educational and informational purposes only. Do your own research before investing and don’t risk more than you can afford to lose. This article expresses my own opinions, and I am not receiving compensation for it (other than from WhaleWisdom). I do not have a business relationship with any company whose stock is mentioned in this article. I or my associates may hold positions in the stocks discussed.


