
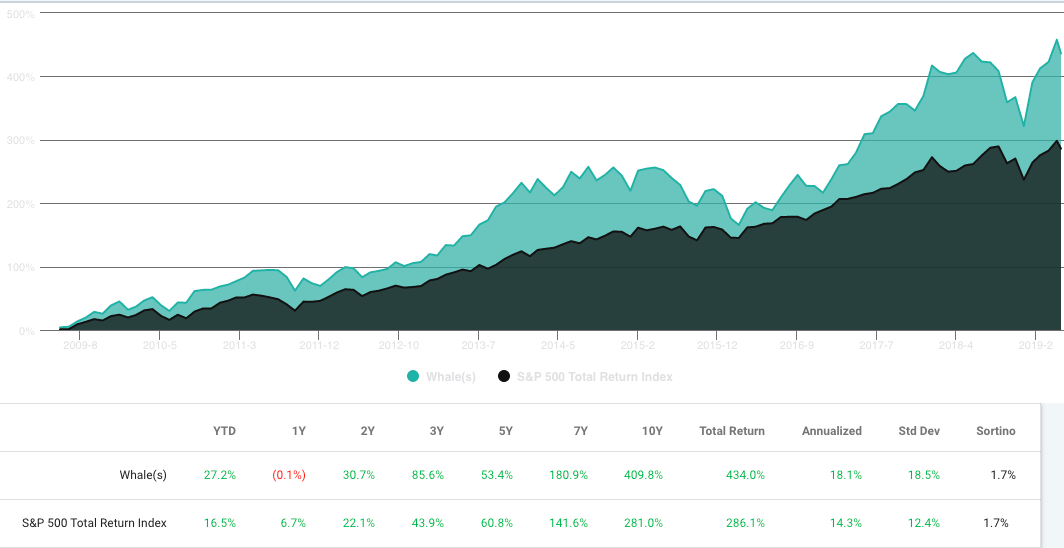
If you had to choose one fund to follow, Tiger Global might be it. Chase Coleman’s Tiger Global has been the best large hedge fund over the last 3 years. At least based on long-only positions disclosed via 13F filings. Copying or “cloning” Tiger Global’s long positions quarterly, would have returned a big-fund leading 22.37% annually since Q1 2016. That’s according to WhaleWisdom.com data.
The beauty of following 13F filings is that an investor can emulate the best ideas of great hedge fund managers. One can profit from world-class hedge fund research, without ponying up millions of bucks to get in the door, paying major fees or being subject to lockups.
And few hedged funds have been better to follow than Tiger Global Management. Since starting Tiger Global in 2001 — after learning the ropes under hedge fund legend Julian Robertson — Chase Coleman’s stock picking has been second to none. At least for big hedge funds — those with 13F holdings of over $10 billion. The top smaller hedge funds, typically focusing on small-cap stocks, often generate higher returns.
Tiger Global’s annual 13F returns over the last decade have averaged 17.80%
The last several years have been no fluke — looking back 10 years, Tiger Global has been one of the top performing hedge funds, generating annualized 13F returns of 17.8%.
As of Q1 2019, Tiger Global had $36.3 billion assets under management. Long holdings as represented by 13F holdings were $18.1 billion. So about half of the hedge fund’s assets were invested in assets not required to be disclosed in 13Fs — presumably private investments and short positions. According to Institutional Investor, Tiger’s long-short fund — Tiger Global Investments — posted a 13.6 percent net gain in 2018.
And, Tiger Global’s private equity investments are apparently paying off in a big way.
But the performance of just Tiger’s 13F positions hasn’t been too shabby. Here is the fund’s top Q1 changes:
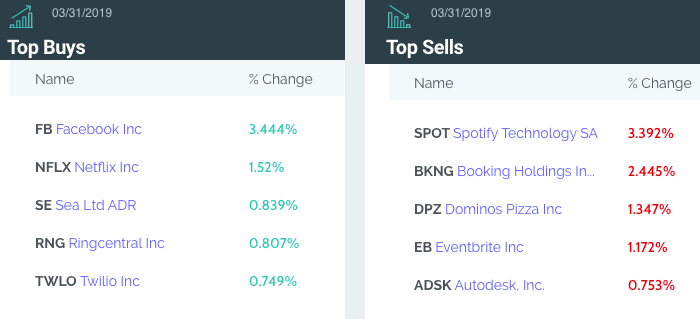
As its name suggests, Tiger Global’s portfolio is focused on equities from around the globe. No less than six of the fund’s top Q1 holdings are companies based overseas. The fund’s top Q1 holding was JD.com (JD), the huge Beijing-based online retailer. U.K.-based Fiat Chrysler (FCAU) was Tiger’s 4th largest holding. Alibaba Group (BABA) was #9.
Tiger Global Management’s top 20 positions for Q1 2019
| Stock | Symbol | Shares Held | Market Value | % of Portfolio | Ranking | % Change | % Ownership | Qtr first owned | Avg Price |
| Jd.com inc adr | JD | 57,850,366 | 1,744,189,000 | 9.7717% | 1 | (0.1222%) | 4.8049% | Q4 2014 | 29.1694 |
| Microsoft corp. | MSFT | 13,292,400 | 1,567,706,000 | 8.783% | 2 | 0.9493% | 0.1726% | Q4 2016 | 74.5982 |
| Facebook inc | FB | 8,838,117 | 1,473,226,000 | 8.2537% | 3 | 64.5219% | 0.3042% | Q4 2016 | 161.863 |
| Fiat chrysler automobiles n.v. | FCAU | 88,296,757 | 1,311,207,000 | 7.346% | 4 | 8.9478% | 5.6312% | Q4 2016 | 15.0156 |
| Amazon.com inc. | AMZN | 704,112 | 1,253,847,000 | 7.0246% | 5 | (5.3631%) | 0.144% | Q2 2015 | 694.1315 |
| Spotify technology sa | SPOT | 8,203,235 | 1,138,609,000 | 6.379% | 6 | (35.9347%) | 4.6057% | Q2 2018 | 168.2309 |
| Apollo global management llc | APO | 37,663,500 | 1,063,994,000 | 5.961% | 7 | 0.00% | 18.6981% | Q1 2017 | 25.1339 |
| Transdigm group inc | TDG | 2,066,000 | 937,943,000 | 5.2548% | 8 | 0.00% | 3.9166% | Q4 2016 | 269.6573 |
| Alibaba group holding ltd adr | BABA | 4,329,245 | 789,871,000 | 4.4252% | 9 | 5.2155% | 0.169% | Q3 2016 | 136.2413 |
| Netflix inc | NFLX | 2,109,813 | 752,275,000 | 4.2146% | 10 | 42.8152% | 0.4838% | Q1 2017 | 246.4394 |
| Booking holdings inc. (priceline) | BKNG | 283,507 | 494,694,000 | 2.7715% | 11 | (37.1692%) | 0.5779% | Q4 2015 | 1352.3073 |
| Stoneco ltd | STNE | 10,597,754 | 435,674,000 | 2.4408% | 12 | 0.00% | 3.8249% | Q4 2018 | 18.44 |
| Fleetcor technologies inc | FLT | 1,727,100 | 425,886,000 | 2.386% | 13 | (3.627%) | 1.4059% | Q4 2012 | 151.0477 |
| Salesforce.com inc. | CRM | 2,286,739 | 362,151,000 | 2.0289% | 14 | 0.00% | 0.2989% | Q4 2017 | 112.7071 |
| Tal education group american depositary adr | TAL | 9,424,023 | 340,019,000 | 1.9049% | 15 | (1.7127%) | 1.6625% | Q4 2015 | 15.4153 |
| Svmk inc | SVMK | 18,446,551 | 335,912,000 | 1.8819% | 16 | (39.4641%) | 14.7478% | Q3 2018 | 16.03 |
| Dominos pizza inc | DPZ | 1,224,850 | 316,134,000 | 1.7711% | 17 | (34.577%) | 2.9444% | Q4 2016 | 182.5083 |
| Eventbrite inc | EB | 14,064,271 | 269,612,000 | 1.5105% | 18 | (2.0885%) | No Data | Q3 2018 | 37.97 |
| Sunrun inc | RUN | 18,583,400 | 261,283,000 | 1.4638% | 19 | 4.3003% | 16.6146% | Q1 2018 | 11.491 |
| Zendesk inc | ZEN | 2,702,000 | 229,670,000 | 1.2867% | 20 | (25.559%) | 2.5243% | Q3 2018 | 69.3064 |
Disclaimer:
Do not construe anything written in this post or this blog in its entirety as a recommendation, research, or an offer to buy or sell any securities. Everything in this blog is meant for educational and informational purposes only. Do your own research before investing and don’t risk more than you can afford to lose. This article expresses my own opinions, and I am not receiving compensation for it (other than from WhaleWisdom). I do not have a business relationship with any company whose stock is mentioned in this article. I or my associates may hold positions in the stocks discussed.


